

Investment Commentaries: Fourth Quarter 2017
| Index Returns | 4th Quarter | Trailing 12 Months |
| S&P 500 US Large Cap Index | 6.6% | 21.8% |
| MSCI All Country World Stock Index | 5.8% | 24.6% |
| Barclays Capital Aggregate Bond Index | 0.4% | 3.5% |
| US Core Consumer Price Index - (Inflation) | 0.5% | 1.7% |
Double-digit broad stock market returns with no down months and record-low volatility. Favorable corporate tax reform. Historically-low unemployment. Low and stable inflation. Moderate, though respectable economic growth.
Can it get any better than this… or is this as good as it gets?
After a year like 2017, thinking about a future in which conditions worsen is about as popular as being an optimist in March of ‘09. Yet, not all the facts point to a rosy and uneventful year ahead. In this quarter’s commentary, we will highlight some important developments from 2017, as well as discuss our view of the current environment and our approach for the year ahead.
2017 Markets in Review
Stocks ended broadly higher in 2017, with all major market categories posting strong percentage gains (see chart below). Globally, emerging markets outperformed developed markets; but both categories beat out domestic stocks. The falling value of the Dollar was a significant contributor to both emerging and developed market returns, as securities priced in foreign currencies became more expensive to buy with less valuable Dollars – a good thing if you already owned them. Both categories demonstrated strong returns outside of currency impact, suggesting that investors globally have become more upbeat in their views of global economic and financial conditions.

In the US, large cap stocks outperformed smaller counterparts. Although the passage of major tax reform in December was met with approval in the markets, stocks were already on track for an above-average year heading into the fourth quarter. By October, investors had broadly adopted a less skeptical and more optimistic view on economic and market conditions.
Bonds, while moderate compared to stocks, also delivered strong returns for the year. A broad index of the bond market that includes both government and corporate bonds increased by 3.6% during the year, while an index of only US Treasury bonds increased by 2.04%. Corporate Investment-Grade and High-Yield (a.k.a. “Junk”) bond indexes both increased by approximately 7%. The level of interest rates usually influences bond prices and returns: rising interest rates force prices down, and falling interest rates force prices up. Interestingly, with four 0.25% increases in the Fed Funds rate announced by the Federal Reserve during the year, bonds still performed well and maintained purchasing power by delivering return in excess of inflation.
Strong performance across asset classes during the year was accompanied by indications that the nine-year economic expansion in the US is not only healthy, but also picking up steam. At latest readings:
- GDP has grown at a 3.2% annualized rate, over and above inflation; compared to 2.8% last year.
- Measures of Consumer Price Inflation are below 2.5%, annualized.The Unemployment Rate is down to 4.1% from 4.7% a year ago, while the Labor Force Participation rate has held steady at 62.7%.
- Corporate Profits have grown by 9.8% year over year.
- November Retail Sales (including online and physical stores) were up 6.3% over last year.
- Housing Starts are up 13% over last year while months’ worth of New and Existing Home Inventories are well-below average at 3.5 and 4.6 months, respectively. Both measures indicate that housing demand significantly exceeds supply.
- The NFIB Small Business Economic Trends recently reported that its Small Business Optimism Index is still near the highest levels in history, primarily because of owners’ views on economic conditions.
Taking all of this information into consideration, we are content to call 2017 a good year financially and economically.
Now, on to the next…
Looking Ahead: What We Are Monitoring

Economic conditions are very important, but they only offer a partial answer to the question we posed above: Can it get any better than this? How companies individually and in aggregate generate and grow profitability within the economic environment, and how asset prices compare to their underlying values are as if not more important.
History shows us that stocks and the economy are clearly married, but they do not often hold hands.
The S&P 500 and US GDP have traveled in the same general direction over time, but stocks are significantly more volatile because the relationships between a) Earnings and GDP (i.e. fundamentals & the economy), and b) Price and Earnings (i.e. investor-behavior & fundamentals) are not stable. We explain the impact of both, below.
Earnings & GDP

In a perfect world, all businesses would generate stable profits in sync with overall economic productivity. In reality, many factors cause corporate profits to fluctuate and deviate from GDP. Over time, the relationship holds, but the impact of those deviations over shorter time periods are one cause for differences between the stock market and the economy.
A deeper dive into small business optimism illustrates a current example where business profits have deviated from economic growth. Small business owners are highly optimistic relative to historical levels. Yet, based on the survey, respondents’ average earnings growth is negative even though sales growth is positive. The primary reason cited for lower profitability is higher costs.
Some trends that are good for the wider economy at this point may detract from businesses’ profitability in the short-term, such as grappling with higher cost of labor (low unemployment) and rising materials costs without the ability to pass those rising costs on to customers by raising prices (low inflation). It is possible that economic momentum will continue to build, while earnings slow or decline in the near-term. Whether stocks continue to perform well is also influenced by the other relationship…

Price & Earnings
Stock returns are also affected by the price investors will pay for underlying economic benefit streams such as cash flow or earnings; hence the widely-used Price to Earnings ratio. This is why in a year like 2015, when earnings declined by -11%, the index level only changed by -0.7%: investors paid a higher price per dollar of earnings. On the other end of the spectrum, when earnings increased by 15% in 2011, the index was unchanged because investors did not adjust prices upward to reflect rising profits.
To answer our own question, we do not think this is as good as it can get. In order for the market to continue upward, earnings must continue to grow and investors must continue to value those earnings at least as much as they do now; or, if earnings stall or fall investors must be willing to pay-up in expectation that earnings will recover. The S&P 500 just completed its 14th consecutive month of positive total returns (the longest streak in the history of the index), and volatility measured by the VIX index is still near all-time lows (the last time it was nearly this low was in January, 2007). There are no signs that those trends are at an end, but we firmly believe they cannot go on forever.
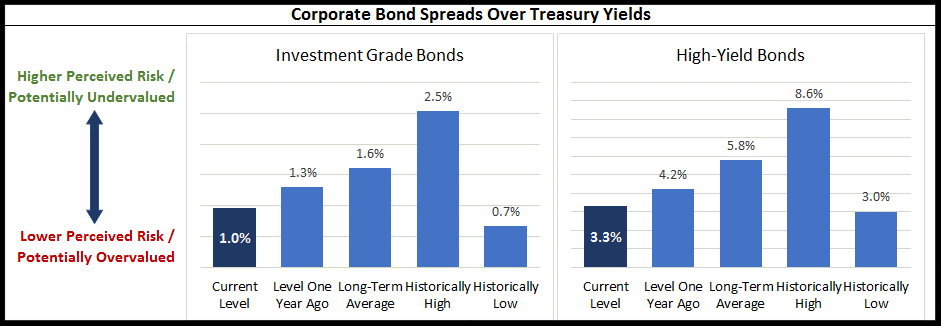
In addition to stock indicators, we are also closely watching key indicators for bonds. A common method to evaluate bond prices is the difference (i.e. spread) between yields on those bonds and yields on US Treasury bonds of a comparable maturity. The higher the spread, the “cheaper” the bond. As the chart below demonstrates, both investment-grade and high-yield corporate bond prices currently incorporate very little risk, and leave little room for deterioration in underlying company fundamentals. This is another indicator of the theme that we discussed above regarding stocks: it cannot go on forever, but that does not mean it is over. Our approach to the current fixed income environment is to structure portfolios to limit interest-rate sensitivity by concentrating on bonds with maturities of between 3-5 years, and minimize credit risk by focusing on investment-grade bonds.
While we have focused on a broad overview of the current market environment in this commentary, much of our on-going analysis relates to the specific companies underlying the equity and fixed income holdings in client portfolios. During the quarter, the most significant changes we made to broadly diversified portfolios were to take gains in select individual US stocks as well as international stock investments, and reinvest the proceeds in fixed income securities with maturities of between three and five years. We believe this shift in allocation allows portfolios to continue to benefit from strong equity turns in a meaningful way, while also preparing for the possible return of a more normal level of volatility in the near term. We do not take lightly the trust you place in us as advisors, and look forward to speaking with you soon.
Matt A. Morley, CVA, CEPA
Chief Investment Officer