

Investment Commentaries: Fourth Quarter 2018
| Index Returns | 4th Quarter | Full-Year 2018 |
| S&P 500 US Large Cap Index | -13.5% | -4.4% |
| MSCI All Country World Stock Index | -11.5% | -14.2% |
| Barclays Capital Aggregate Bond Index | 1.6% | 0.0% |
| US Core Consumer Price Index - (Inflation) | 0.5% | 2.2% |
*All figures as of 12/31/2018 unless otherwise noted.
In our January 2018 commentary, we asked: “Can it get any better than this…or is this as good as it gets?” We had just ended a year of strong returns and record-low volatility for stocks; steady economic growth; low and stable inflation; and historically low unemployment. By the end of 2018, 11 out of 12 benchmarks tracking major asset classes and segments had dropped into negative territory for the year. The bad news is that the factors leading to the recent downturn are still present and may lead to additional volatility in the near-term. The good news is that diversified portfolios have survived and thrived through many periods with similar challenges in the past. As we begin the new year, we review current economic and market conditions, as well as risks and opportunities we see ahead for client portfolios.

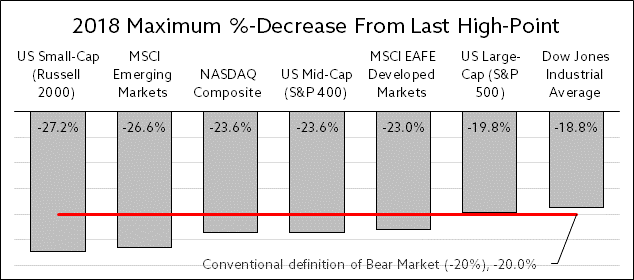
On a total return basis, the only major market segment with positive returns last year was bonds, with the Barclays US Aggregate Bond Market Total Return Index up by 0.1%. Measured only by price, all market segments were down for the year. Even US stocks, which had remained strong through the end of the 3rd quarter, experienced a significant downturn which resulted in negative returns for the year. At its worst, the level of the S&P 500 had declined from its previous high by 19.8%, which is only 0.2% away from the conventional -20% threshold for a bear market. Now two weeks into the new year, markets have turned sharply positive with Small-Cap and Emerging Markets stocks leading the way. Both the violent downturn heading out of 2018, and the marked improvement coming into 2019 reinforce our view that market volatility is back, and it is here to stay.
We see continuing interest rate increases by the Fed, rising inflation, escalating trade wars, and fear of a slowing economy as the major catalysts for recent volatility. We also think selling investments to harvest losses for tax purposes may have played a larger part than usual in the severity of the downturn headed into the year-end.
Interestingly, the economic backdrop remained largely positive even as markets dropped:
Following an exceptionally strong second quarter, with the U.S. Gross Domestic Product (GDP) growing by 4.2%—its fastest pace in almost four years—the economy grew by another solid 3.4% in the third-quarter. The current economic expansion is now in its 116th month, making it the second-longest economic expansion in U.S. history. The longest span—120 months—lasted from 1991 to 2001.
U.S. nonfarm productivity—or the level of employee output per hour—rose in 2018’s first quarter by 0.3% and in Q2 by 3.0%—its sharpest gain since a 2.9% climb in Q4 2015—before posting an upwardly revised 2.3% increase in 2018’s third quarter.
After rising for 21 of the last 22 months, including a 0.5% gain in October, U.S. personal incomes climbed by another 0.2% in November (vs. 0.3% expected), the U.S. Commerce Department said on December 21.
That said, there are indicators that the economy is losing some steam after significant gains in 2018:
Consumer Confidence: The Conference Board Consumer Confidence Index declined in November, following an improvement in October. The Index now stands at 135.7 (1985=100), down from 137.9 in October. After declining in July and August, the Thomson Reuters/University of Michigan Index of Consumer Sentiment bounced back in September before declining in both October and November, falling from September’s 100.1 reading to 98.6 in October and to 97.5 in November.
Economic Optimism: After rising from 55.7 in September to 57.8 in October—just off August’s 2018 high of 58.0—the Investor’s Business Daily/TIPP Economic Optimism Index in the United States fell to 56.4 in November. Readings above 50 indicate optimism, while those below 50 signify pessimism. Additionally, after its record-setting August and continued strength through October, the National Federation of Independent Business (NFIB) Index of Small Business Optimism declined sharply to 104.8 in November (vs. 107.3 expected). Still, November was the index’s 25th consecutive month in the top 5% of 45 years of survey readings.
New U.S. home prices fell by 3.6% to $309,700 in October, according to the U.S. Census Bureau data. With revisions to previous months’ data, prices have now declined for three straight months. Additionally, following declines in seven of the previous ten months, sales of new U.S. homes fell by 8.9% in October, dropping to a more than 2-1/2-year low, according to a November 28 report from the U.S. Commerce Department.
While we are watching signs of economic weakness diligently, GDP growth of 3.4%; inflation of 2%; and unemployment still below 4% with a rising labor force participation rate all point to a healthy economic backdrop.
Yet, interest rates – a significant driver of both equity and bond markets – continued to rise as a result of the Fed’s monetary policy tightening. Despite strong protests from President Trump and growing fears of an economic slowdown, the U.S. Federal Reserve on December 18 raised rates by another quarter point to a range of 2.25% to 2.50%. Since then, Fed Chair Jerome Powell has indicated on two separate occasions that the Fed is willing to consider delaying any further rate hikes as they evaluate updated economic data.
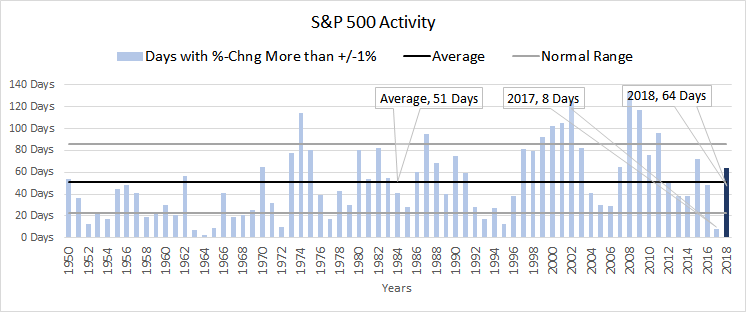
While the last few months may feel like an anomaly compared to the last two years, history points to recent volatility as a return to normalcy.
As we pointed out in our Client Bulletin on November 26th, the 60+ days with greater than 1% up or down movement in the S&P 500 is well-within the normal historical range, but the 8 such days experienced in 2017 was unusually low.
We manage portfolios with a long-term perspective, which protects portfolios from the full-brunt of market downturns and allows us to focus on looking for opportunities rather than fighting for the exit when volatility picks up. Most recently, we further reduced exposure to lower-quality fixed income holdings in favor of short-term US Treasury bonds; and we replaced US equity sector ETF’s with high-quality individual stocks that had significantly declined in price along with the market.
We value frequent communication with our clients, to discuss changing conditions and to ensure that we understand and stay updated on your objectives. We do not take lightly your patience or the trust you place in us as advisors, and we look forward to speaking with you soon.
Matt A. Morley, CVA, CEPA
Chief Investment Officer